
Heads up — this is directional analysis, not gospel. Every traffic figure below is a third-party estimate (DataForSEO, US Google, July 2026), not a brand’s audited analytics. Property counts are approximate and shift constantly. This is opinion and modeling based on public info at the time of writing, may be out of date, and is not business, legal or financial advice. We are not affiliated with any brand named here. Independently validate before you make a decision on it.
Download this study as a one-page PDF
Ask “what are the highest-traffic hotel websites in America” and you get a boring answer: the biggest chains win. Marriott.com pulls an estimated 81 million organic visits a month. Hilton.com pulls 70 million. Of course they do — between them they operate something like 16,000 hotels. Handing the traffic crown to Marriott is like handing the “most total rainfall” trophy to the ocean.
The interesting question is the one nobody asks: which hotel website earns the most traffic per hotel it operates? Because a brand with 9,000 properties should out-traffic a brand with 22 resorts. If it doesn’t do so by a wide enough margin, the little guy is quietly running one of the most efficient search operations in the country.
So we built two leaderboards. First the raw one everybody expects. Then the adjusted one that flips it on its head — and reveals that a Florida timeshare-resort company most SEO people have never studied is, per property, roughly as search-efficient as Four Seasons.
Leaderboard 1: raw estimated organic traffic
Here is the straightforward ranking — estimated monthly organic search traffic (ETV) for major hotel-brand domains, with approximate portfolio size alongside.
| Rank | Website | Est. organic traffic / mo | Approx. properties |
|---|---|---|---|
| 1 | Marriott.com | 81,207,061 | ~9,000 |
| 2 | Hilton.com | 70,532,767 | ~7,500 |
| 3 | IHG.com | 23,517,645 | ~6,300 |
| 4 | Hyatt.com | 20,837,052 | ~1,300 |
| 5 | ChoiceHotels.com | 13,836,495 | ~7,500 |
| 6 | FourSeasons.com | 12,339,109 | ~130 |
| 7 | WyndhamHotels.com | 9,706,952 | ~9,000 |
| 8 | OmniHotels.com | 7,413,657 | ~50 |
| 9 | BestWestern.com | 5,322,035 | ~4,700 |
| 10 | WestgateResorts.com | 3,115,783 | ~22 resorts |
A few things already look strange if you read carefully.
Hyatt sits at #4 with 20.8M visits from only about 1,300 hotels — nearly matching IHG’s 23.5M off roughly a fifth of the footprint. Four Seasons cracks the top six with 12.3M visits from about 130 hotels, out-ranking Wyndham’s near-10M despite Wyndham operating something like 70 times as many locations. And Omni — a 50-ish property luxury chain — quietly out-traffics Best Western, which runs thousands of hotels.
Those aren’t rounding errors. They’re the whole story. The raw leaderboard is measuring portfolio size wearing a traffic costume. To see who is actually good at search, you have to divide it out.
Leaderboard 2: traffic per property (the metric that matters)
Take each brand’s estimated traffic and divide by its approximate property count. You get a rough “search demand per hotel” figure. It is crude — averages hide huge variation between a flagship resort and a highway-exit franchise — but it is far fairer than raw volume for comparing a mega-chain to a boutique portfolio.
| Rank | Brand | Approx. traffic per property |
|---|---|---|
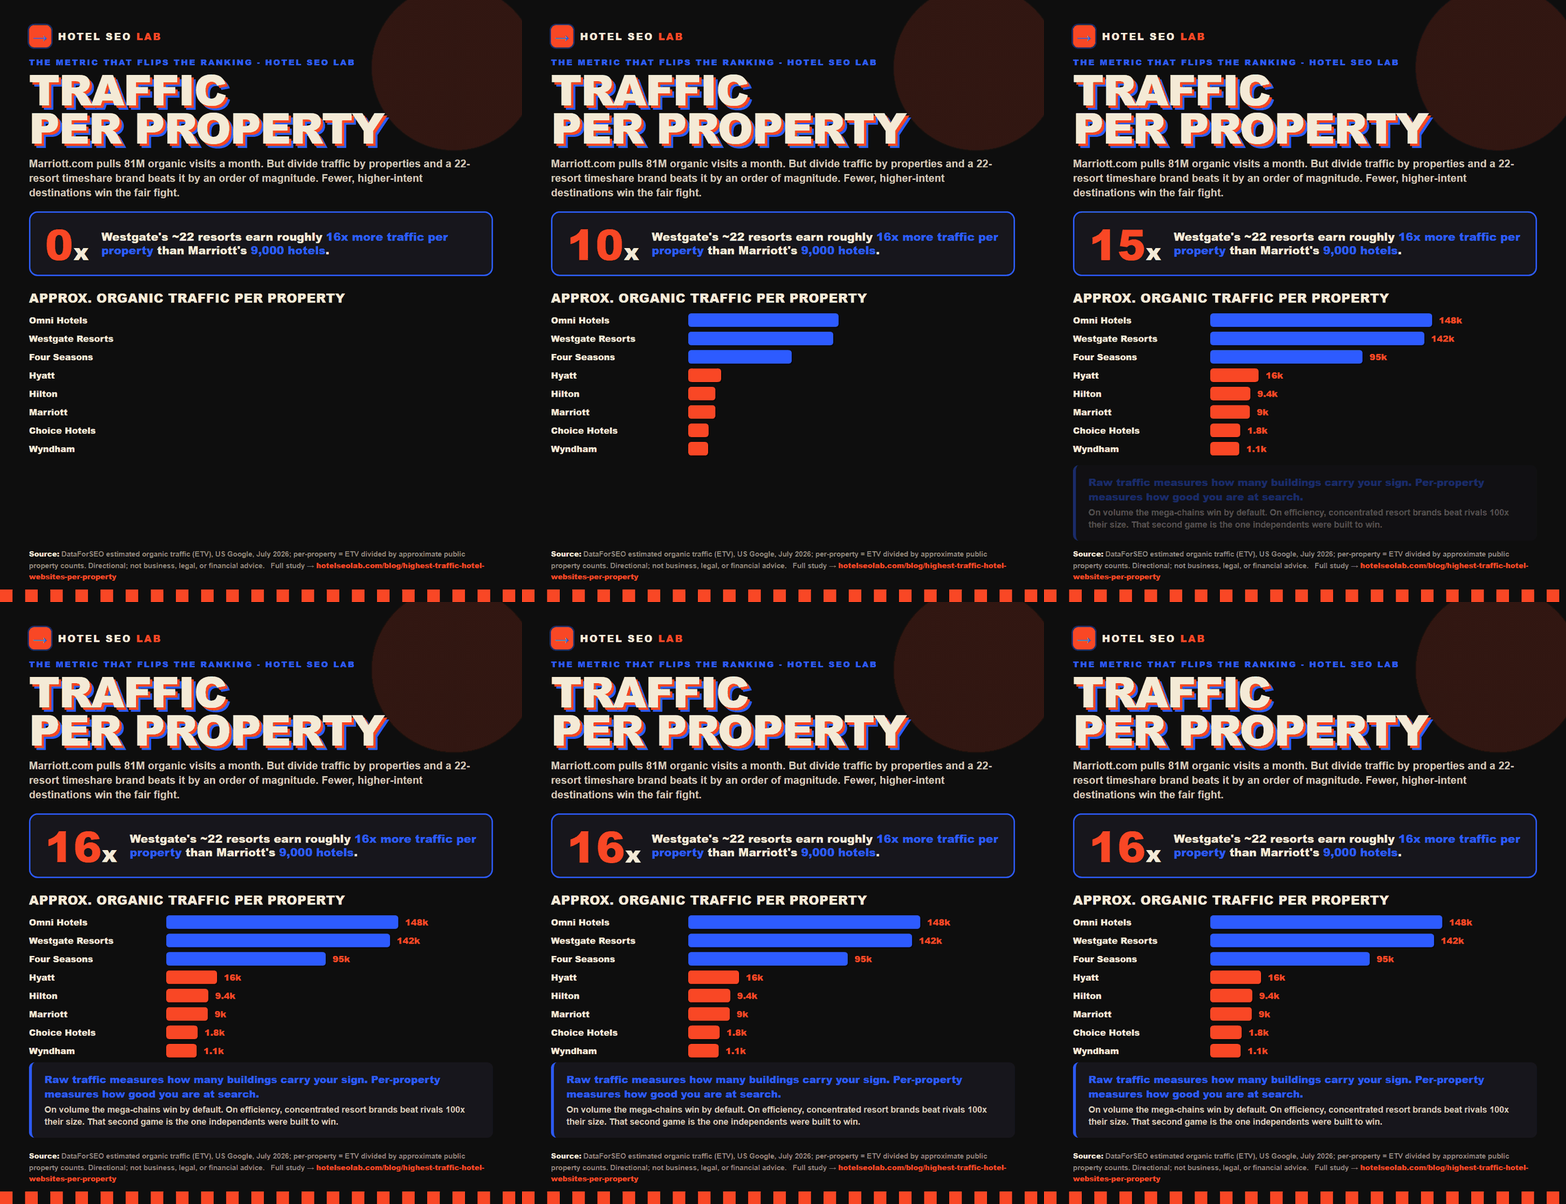
| 1 | Omni Hotels | ~148,000 |
| 2 | Westgate Resorts | ~142,000 |
| 3 | Four Seasons | ~95,000 |
| 4 | Hyatt | ~16,000 |
| 5 | Hilton | ~9,400 |
| 6 | Marriott | ~9,000 |
| 7 | Choice Hotels | ~1,800 |
| 8 | Wyndham | ~1,100 |
The ranking completely inverts. Marriott, the raw champion, drops to sixth. Wyndham — tied with Marriott on portfolio size at ~9,000 properties — collapses to last at roughly 1,100 visits per hotel, because its traffic is spread across a vast, low-intent economy footprint. Choice sits just above it for the same reason.
And at the top, three concentrated resort brands separate from the pack by an order of magnitude: Omni (~148k), Westgate (~142k) and Four Seasons (~95k). Each generates traffic per property that rivals or beats brands operating thousands of locations.
The honest read: a big brand’s total traffic is mostly a function of how many buildings carry its sign. Per-property efficiency is a function of demand concentration and how well the site converts brand-plus-destination intent. Those are two different competitions, and independent hotels compete in the second one.
Why concentrated resort brands win the efficiency race
Three structural reasons, and all three are learnable.
1. High-intent destination demand. An Omni or a Westgate property tends to be the destination — Omni Grande Lakes, Westgate Las Vegas, Westgate Smoky Mountains. People search the resort by name because the resort is the trip. A highway Days Inn is a commodity bed near an exit; nobody dreams about it in January. Destination gravity is the single biggest input to organic demand, and it is exactly the demand OTAs try to intercept with their destination landing pages.
2. Fewer URLs fighting over the same authority. Marriott’s domain authority is split across ~9,000 property pages plus dozens of sub-brands. Westgate concentrates its link equity and content firepower across ~22 resorts. Every internal link, every review, every piece of content compounds onto a small page set instead of being diluted across a continent. Concentration is an SEO advantage, not just a portfolio one.
3. The site is the product page. For a resort brand, the property page has to sell a $400 experience, not just confirm a room type. That forces better content, better photography, better structured data and better conversion design — the same discipline we push in book-direct CRO. Good UX and rich content feed rankings; rankings feed traffic; traffic per property climbs.
None of that requires a 9,000-hotel balance sheet. It requires concentration and intent — which is the natural position of an independent hotel or a small resort group. You are structurally built to win the per-property game. Most independents just never realized that was the game they were playing.
Westgate: quietly one of the most SEO-efficient hotel brands in America
Give Westgate its due. On the per-property math, WestgateResorts.com earns roughly 142,000 estimated visits per resort — versus Marriott’s roughly 9,000. That is not a typo and it is not a fluke. It is what happens when you run a couple dozen large, brand-name destination resorts, point all your domain authority at them, and treat each property page like a landing page instead of a directory entry.
Westgate will never top the raw leaderboard — 22-ish resorts cannot out-volume 9,000 hotels, and pretending otherwise would be exactly the kind of false claim we refuse to make. But “biggest” and “best per unit” are different trophies. On efficiency, Westgate is playing the same game an ambitious independent should play, and playing it well. Four Seasons (~95k) proves the luxury version of the same thesis; Omni (~148k) edges ahead at the top.
If you run one hotel or a small group, these are your comps — not Marriott. Your realistic ceiling is “how much demand can one great property capture,” and the resort brands show that ceiling is high.
What this means for an independent hotel
You are never going to out-traffic Hilton in raw terms, and you shouldn’t try. You should try to win your name plus your destination so completely that no OTA, aggregator or AI answer gets between you and a guest who already wants your building. Here is how the per-property lesson translates into work.
Own your branded and destination demand. Rank first for [your hotel name] and dominate “[hotel type] in [your city].” That is your concentrated-brand advantage — a small page set that every link and review can compound onto. Our hotel SEO service is built around exactly this, and our breakdown of how OTAs steal your search shows what you are fighting for.
Fix the two-line math on where the traffic goes. Per-property efficiency only pays if the visit converts direct. Every booking you push through an OTA hands over 15–25%. Run the numbers in the book-direct math, then close the gap with conversion work on your own site.
Get the local layer right. For a single property, Google Business Profile and the GBP playbook are often a bigger traffic lever than anything on-page. Local pack visibility is the independent’s version of destination gravity.
Show up in AI answers, not just blue links. Increasingly the “search” that matters happens inside ChatGPT and Google’s AI answers. If those tools can’t cite you, you’re invisible to a growing slice of demand — which is the whole point of our AI visibility work. The concentrated brands feed clean structured data into this layer; you can too.
Treat content and reputation as ranking fuel. Reviews, fresh content and rich property pages are what let resort brands compound authority onto a tiny page set. That is content and reputation, and it is available to a 30-room inn as much as to Four Seasons. If you run extended-stay or aparthotel inventory, the demand dynamics are different again.
The one-line takeaway
Raw traffic measures how many buildings you own. Traffic per property measures how good you are at search. On the first metric the mega-chains win by default. On the second, concentrated resort brands — Omni, Westgate, Four Seasons — beat brands 100 times their size, and they do it with advantages an independent hotel already has: a focused portfolio, real destination demand, and a site that has to sell, not just confirm.
Stop benchmarking yourself against Marriott’s 81 million visits. Start benchmarking against ~142,000 visits per property — and go win your name and your city.
How we got this data: figures are DataForSEO estimated organic traffic (ETV) for each domain on US Google, July 2026. “Traffic per property” is estimated traffic divided by an approximate property count we assigned from public brand disclosures; property counts are rounded and directional, and small brands’ figures move sharply with a single opening or closing. These are modeled third-party estimates, not audited analytics — use them for relative scale, not precision. Opinion and directional analysis based on public info at time of writing, may be out of date, subject to independent validation. Not affiliated with any brand named. Not business, legal or financial advice.
Want to see where your hotel actually ranks on the metric that matters — and how much of your demand OTAs are intercepting before it reaches you? Book a visibility teardown and we’ll show you the per-property picture for your property, honestly, no guaranteed-#1 nonsense.